Filter
8
Filtered Results: 8
Text search:
C.
Hasenkopf
and
K.
Lee
Featured
New Publications
1
Language
Document type
Studies & Reports
8
Countries / Regions
Nepal
1
Nigeria
1
West and Central Africa
1
South–East Asia Region
1
Bangladesh
1
India
1
Pakistan
1
Authors & Publishers
Publication Years
Category
Statistics
7
Toolboxes
Clean air
8
During the first year of the Covid-19 pandemic, the world’s economy slowed. Yet, the global annual average particulate pollution (PM2.5) was largely unchanged from 2019 levels. At the same time, growing evidence shows air pollution—even when experienced at very low levels—hurts human health. T...
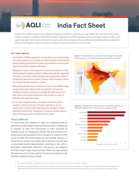
India is the world’s second most polluted country. Air pollution shortens average Indian life expectancy by 5 years,
relative to what it would be if the World Health Organization (WHO) guideline fine particulate pollution (PM2.5) of 5 μg/m3 was met. Some areas of India fare much worse than avera...
Virtually all (99.9 percent) of Southeast Asia’s 656.1 million people live in areas where particulate pollution exceeds the World Health Organization (WHO) guideline of 5 μg/m³. Despite the lockdowns of the pandemic, pollution continued to rise in much of Southeast Asia in 2020. This pollution c...
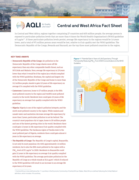
In Central and West Africa, regions together comprising 27 countries and 605 million people, the average person is exposed to particulate pollution levels that are more than 4 times the World Health Organization’s (WHO) guideline of 5 μg/m³1. If these particulate pollution levels persist, averag...
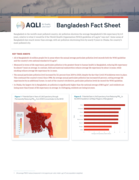
Bangladesh is the world’s most polluted country. Air pollution shortens the average Bangladeshi’s life expectancy by 6.9 years, relative to what it would be if the World Health Organization (WHO) guideline of 5 μg/m³ was met. Some areas of Bangladesh fare much worse than average, with air poll...
Pakistan is the world’s fourth most polluted country. Air pollution shortens the average Pakistani’s life expectancy by 3.8 years, relative to what it would be if the World Health Organization (WHO) guideline of 5 μg/m3 was met.1 Some areas of Pakistan fare much worse than average, with air pol...
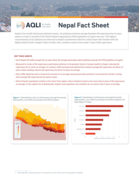
Nepal is the world’s third most polluted country. Air pollution shortens average Nepalese life expectancy by 4.1 years, relative to what it would be if the World Health Organization (WHO) guideline of 5 μg/m3 was met.1 The highest concentrations of air pollution are observed in Nepal’s southwes...
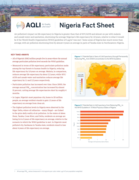
Air pollution’s impact on life expectancy in Nigeria is greater than that of HIV/AIDS and almost on par with malaria and unsafe water and sanitation, shortening the average Nigerian’s life expectancy by 1.8 years, relative to what it would be if the World Health Organization (WHO) guideline of 5...